The board
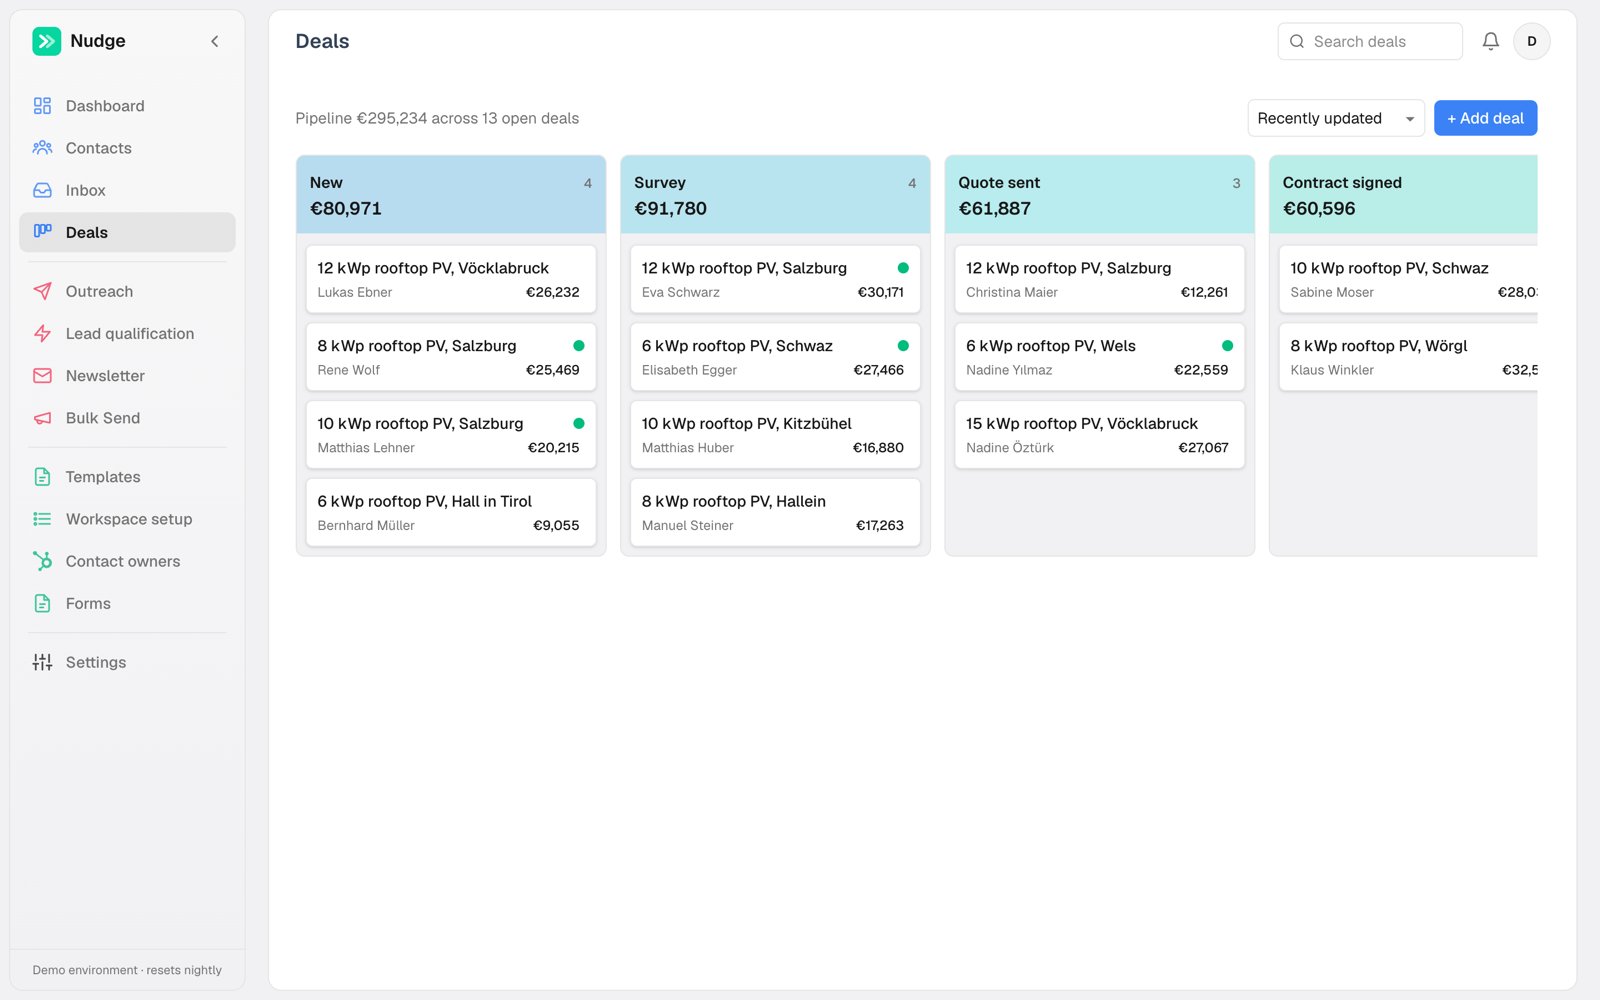
The first column and the two closing columns default to New, Won and Lost. Rename any of them in Workspace setup → Deals to use your customers’ wording. The names also appear in contact stage choices, closing controls and the overview. Changing a name keeps every deal’s stage and outcome. Clearing it restores the default in each user’s language. The time closed deals stay visible is configured in Workspace setup. The Board and Overview tabs align with the Deals heading. In dark mode, stage columns have a lighter background so the lanes and their cards are easier to distinguish. The board aligns with the controls above it. Columns share the available width on wider screens; on narrower screens, scroll horizontally to see more stages. Deals live on a kanban board grouped by stage. Each column starts with a colored dot, the stage name, how many deals it holds and their total value. Won is green and Lost is red; the other stages take their color from their place in the pipeline. Stages are yours to define per workspace. Add deals from the board or directly on a contact’s page; a deal always belongs to a contact, so the full conversation history is one click away. Each card is a short list, one line per detail, each behind its own symbol:- Who. The company (a briefcase) or the contact (a person). Click it to open the contact.
- When the deal was created. A closed deal shows when it was won or lost instead.
- The amount. Click it to change it.
- The other of the two: the contact person under a company, or the company under a contact when they have one.
- The owner, with their initials: the person on your team who handles this contact.
- A note about the deal, such as “Setup for 20 people”. Click it to write or edit. A deal doesn’t need a name; the note is a line to remember what it’s about.
- The next meeting booked with the contact, such as “Meeting Thu 14:00”.
Contact Status in standalone workspaces
A contact can have several deals. Its Status reflects their combined outcomes:- Any open or won deal gives the contact Deal Status.
- If it has deals and every one is lost, its Status is Lost.
- Contacts without deals keep their ordinary Status.
The dashboard
The Dashboard reads the same data and answers the owner questions: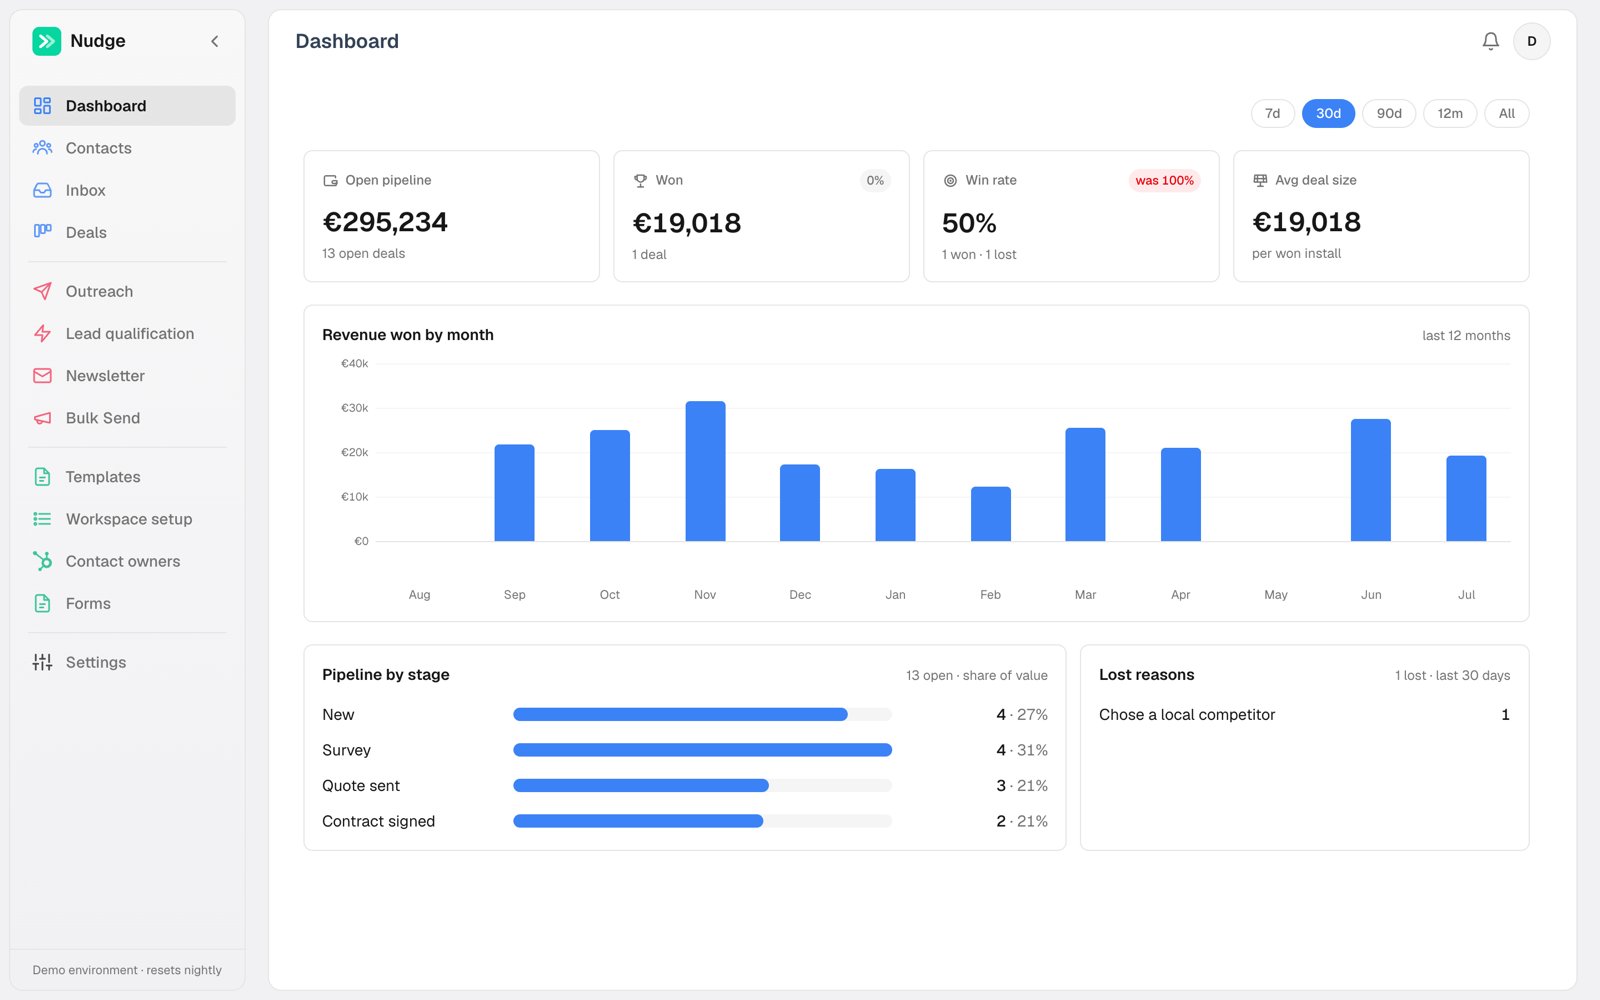
- Open pipeline and its deal count
- Won value and win rate for the selected period, with trend against the previous one
- Revenue won by month across the last 12 months
- Pipeline by stage and lost reasons, so you see where deals die
Outreach analytics
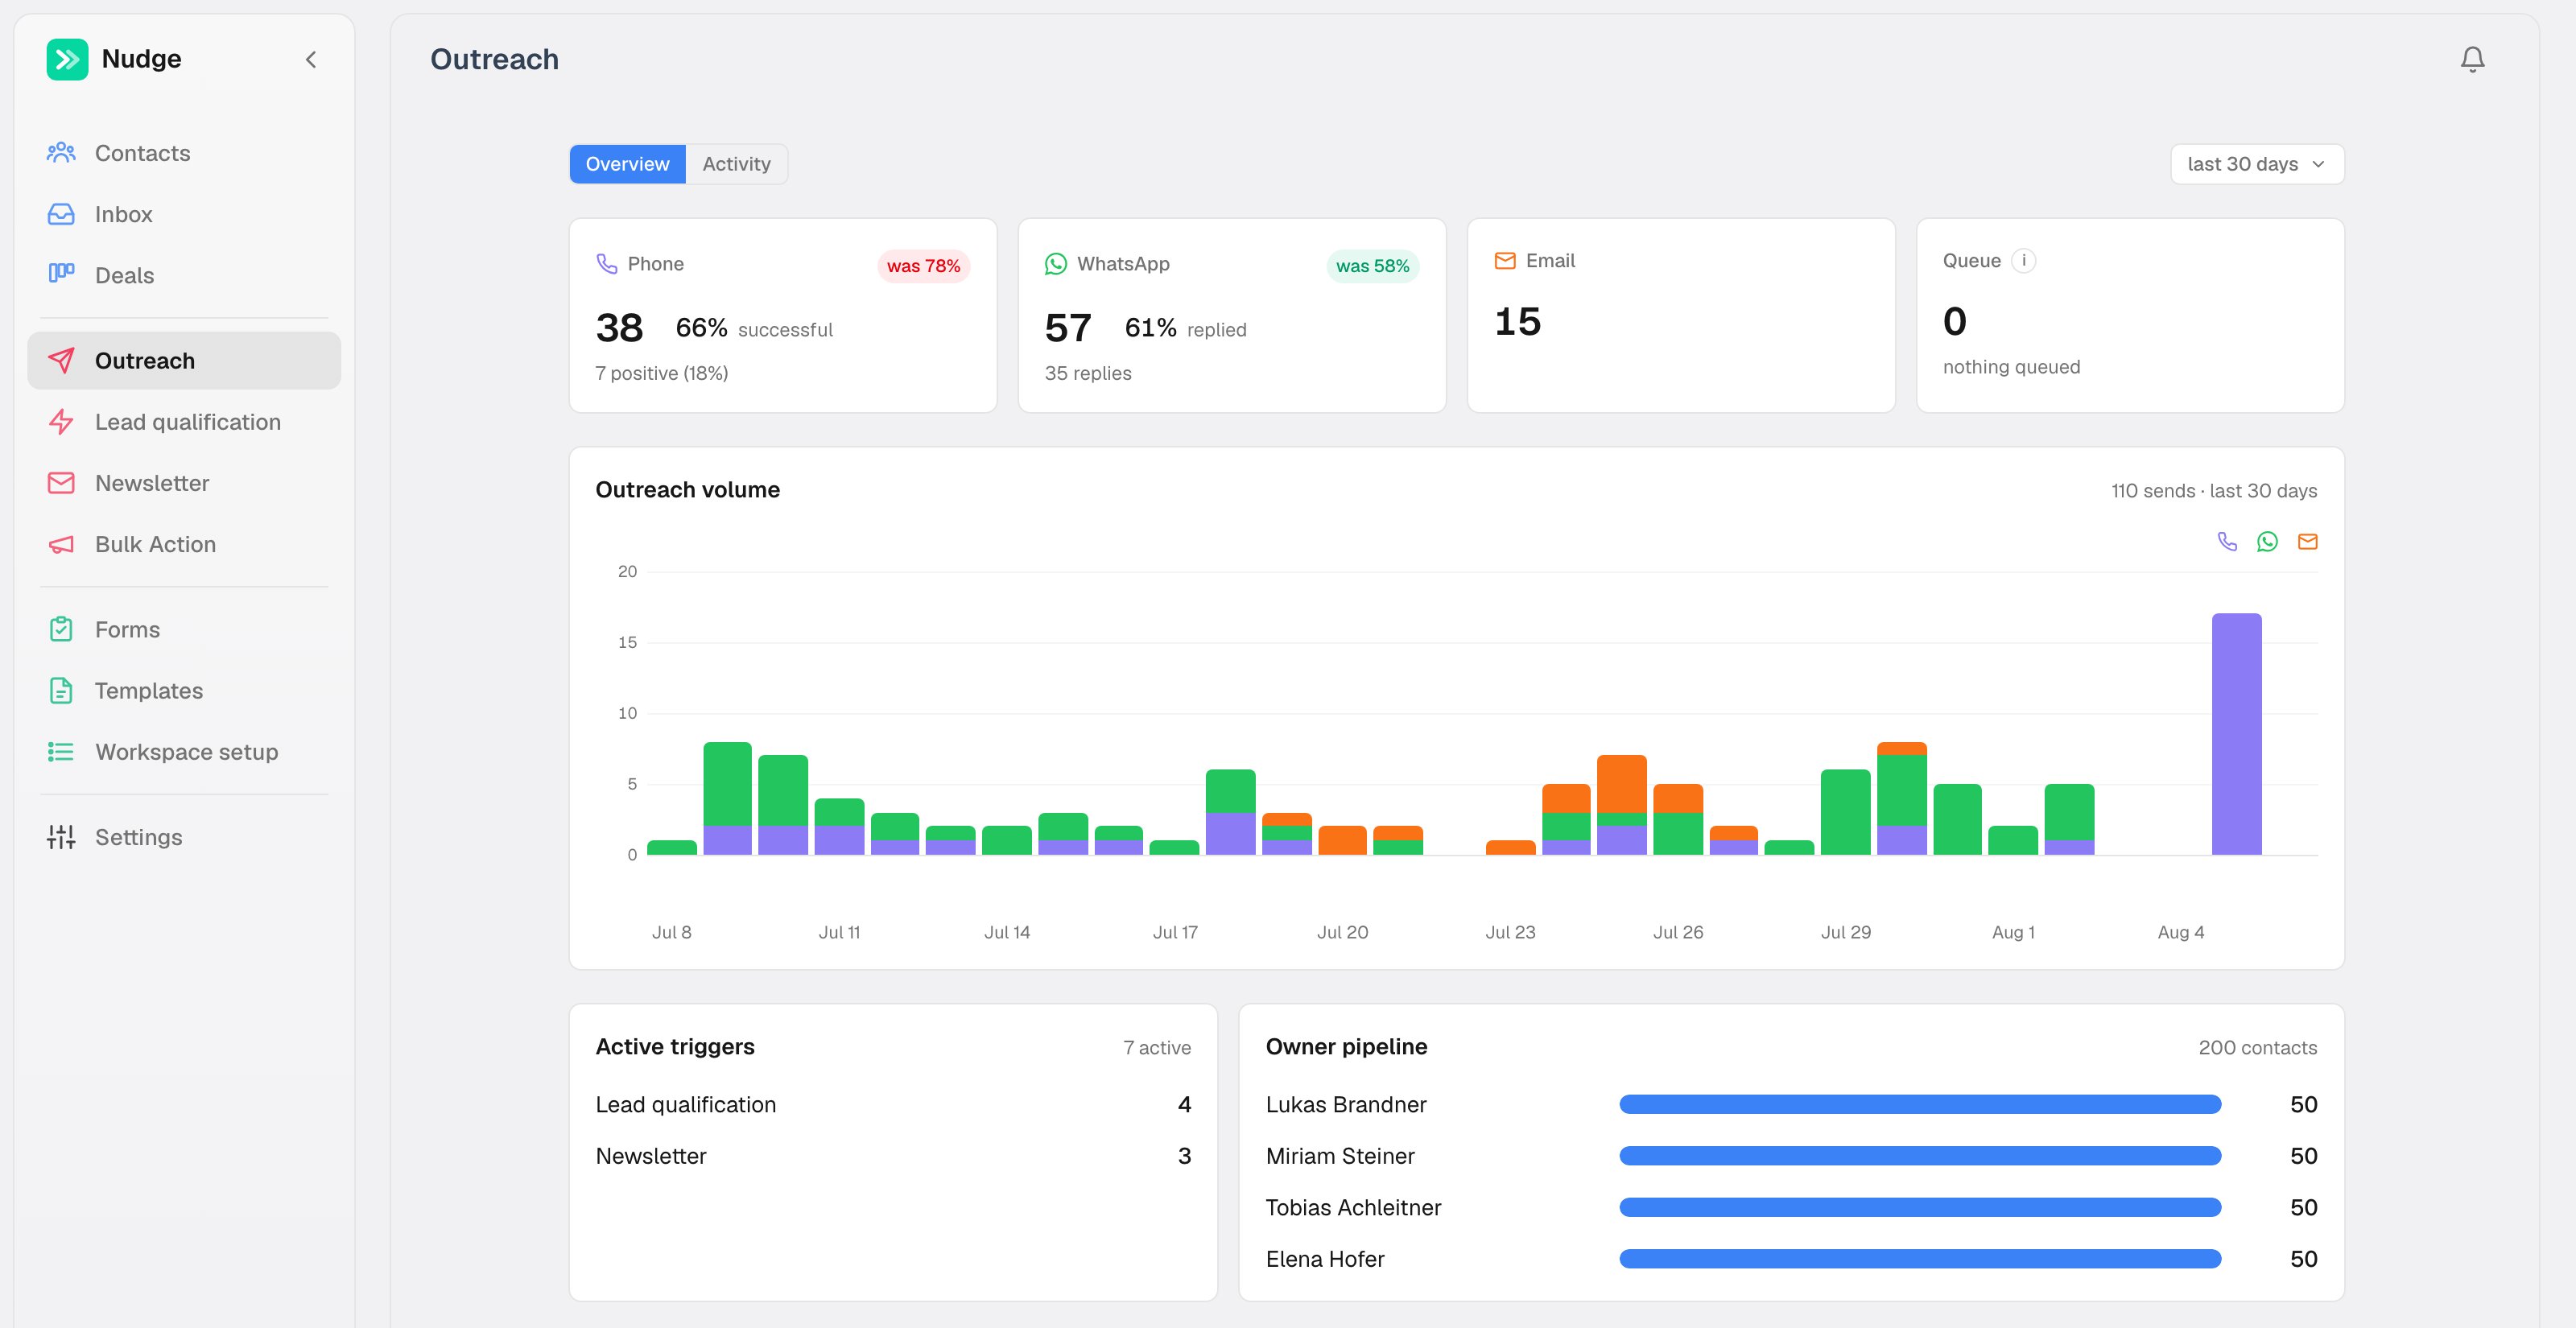
The Outreach tab covers the activity side. Each channel gets its own card showing how much went out and how it landed: calls answered and the minutes they took, WhatsApp messages replied to, emails opened. A live queue card opens the full list of what is still waiting to send. Below that you get sends per channel per day, then a Journeys table with one row per voice agent: calls, the share answered, positive calls (the lead said yes to a qualifying question) with their share of the answered calls, and minutes. If a status has its own reply SLA (set in Workspace setup → SLAs), a card at the bottom shows the contacts in that status who wrote back and are still waiting for your team, how many are past the limit, and how long the oldest has waited. Changing a contact’s status takes them off the count. A rate only appears once there is something to report. A channel with sends but no measured outcome shows the send count alone rather than a zero, because “0% opened” and “we can’t see opens yet” are not the same thing and should not look the same.